Observability: Why Monitoring Isn't Enough for Modern Systems
Dennis Weston
November 25, 2025
Quick Navigation
- The Problem
- Monitoring vs Observability
- The Three Pillars
- Implementation Strategy
- Common Mistakes
- Your Next Move
The Problem
An alert fires: "API latency increased." You check dashboards. CPU looks normal. Memory is fine. Database metrics are healthy. The alert is real—customers are complaining—but nothing in your monitoring explains why.
You spend hours correlating metrics across different tools. Checking logs from multiple services. Trying to reproduce the issue in staging. By the time you understand the problem, customers have churned and the issue has mysteriously resolved itself.
This is the reality of debugging modern distributed systems with traditional monitoring.
Why Traditional Monitoring Fails
Monolithic applications were predictable. When something broke, you knew where to look. CPU spiked, disk filled up, database connection pool exhausted. Simple cause and effect.
Microservices destroyed this simplicity. A single user request touches dozens of services. Any one could introduce latency. Failures cascade in unexpected ways. Network issues cause retries that amplify load. A database query in Service M slows down because Service A's behavior changed.
Traditional monitoring—checking known metrics against thresholds—can't handle this complexity. You can't predict every failure mode in a distributed system. You can't pre-define dashboards for unknown problems.
Monitoring vs Observability
Monitoring asks: "Is the system working?" It tracks known metrics against predetermined thresholds. When a threshold is crossed, it alerts.
Monitoring is great for known failure modes. CPU too high? Alert. Disk full? Alert. But monitoring can't answer questions you haven't anticipated.
Observability asks: "Why isn't the system working?" It provides tools to explore and understand system behavior, especially for problems you've never seen before.
Observable systems let you ask arbitrary questions about system state without predicting those questions in advance.
The Key Difference
With monitoring, you must know what to measure and what thresholds matter before problems occur.
With observability, you can debug novel issues using high-cardinality data that captures all the context about what the system was doing when things went wrong.
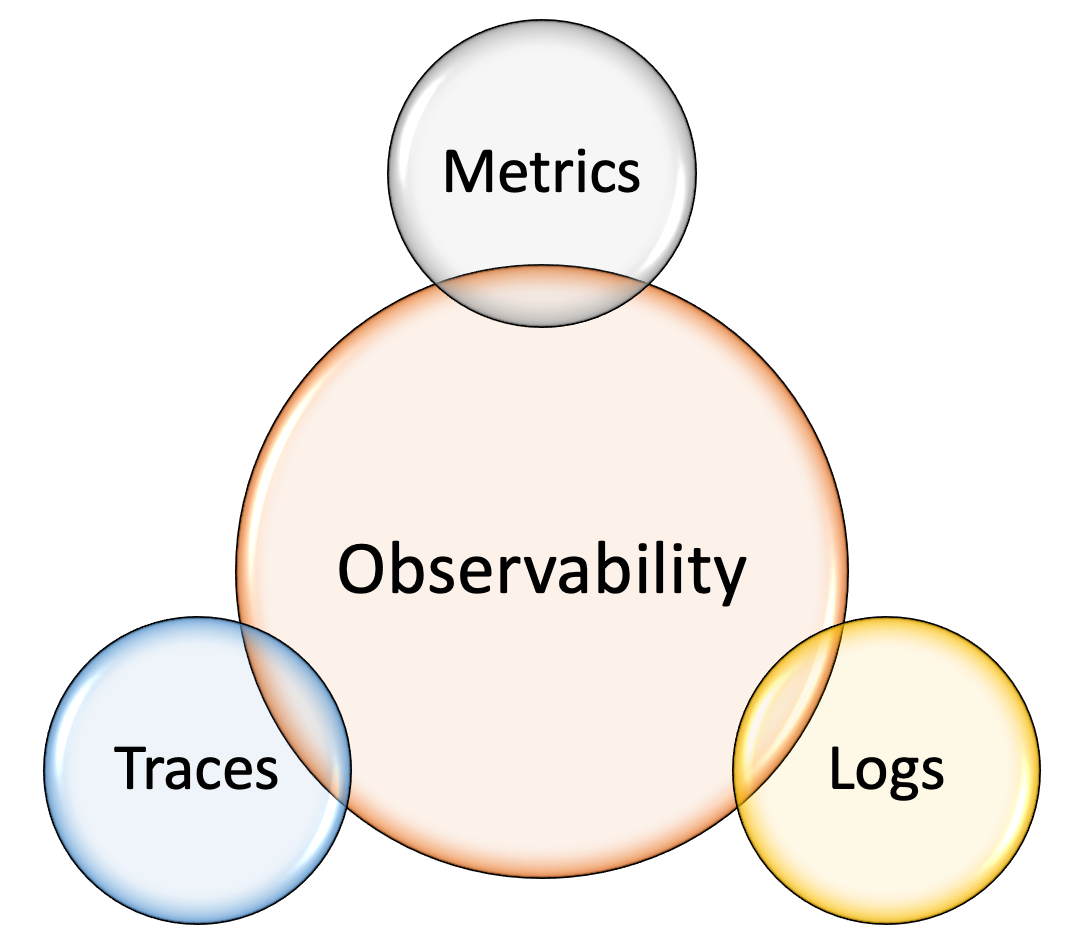
The Three Pillars
Observability requires three types of telemetry: metrics, logs, and traces.
Metrics: The What
Metrics are numerical measurements over time. Request rate, error rate, latency percentiles, CPU usage, memory consumption.
Metrics answer: "What is happening in the system?"
They're cheap to collect and store. They aggregate well. You can query metrics across millions of time series efficiently.
But metrics lack context. A metric tells you API latency increased, not why or which requests.
Logs: The Why
Logs are timestamped records of discrete events. Application errors, debug statements, security events.
Logs answer: "Why did something happen?"
They provide rich context: stack traces, user IDs, request parameters. But logs are expensive to store at scale and difficult to query efficiently.
Traces: The Where
Traces track individual requests as they flow through distributed systems. Each service adds a span showing what it did and how long it took.
Traces answer: "Where in the system is the problem?"
A trace shows the entire journey of a request: which services it touched, in what order, how long each operation took, where errors occurred.
Traces are essential for debugging distributed systems. Without them, you're guessing which service introduced latency.
Implementation Strategy
Phase 1: Instrument Everything
Observability starts with instrumentation—capturing telemetry from all layers of your system.
Application instrumentation - Libraries like OpenTelemetry automatically capture metrics, logs, and traces from applications with minimal code changes.
Infrastructure instrumentation - Collect metrics from Kubernetes, containers, load balancers, databases. Use exporters (Prometheus exporters, CloudWatch, etc.).
Unified instrumentation - Use consistent formats and protocols. OpenTelemetry is becoming the standard. Adopt it to avoid vendor lock-in.
Phase 2: Implement the Three Pillars
Metrics collection - Prometheus for pull-based metrics. Or push to managed services (Datadog, New Relic, Grafana Cloud).
Centralized logging - Aggregate logs from all services. Use structured logging (JSON) for easier querying. Tools: ELK stack, Grafana Loki, Splunk.
Distributed tracing - Implement trace context propagation across services. Tools: Jaeger, Zipkin, or managed services (Honeycomb, Lightstep).
Correlation - Link metrics, logs, and traces. When investigating an issue, jump from a metric spike to related logs and traces.
Phase 3: Build for High Cardinality
Traditional monitoring aggregates aggressively to reduce storage costs. This loses vital context.
Observability tools handle high-cardinality data—millions of unique combinations of labels and dimensions.
Tag everything - Customer ID, request ID, service version, deployment, feature flags. Rich context enables debugging.
Don't pre-aggregate - Store raw data. Query it flexibly. Modern observability platforms handle this scale.
Sampling for traces - You can't store every trace in high-volume systems. Implement intelligent sampling: always keep errors and slow requests, sample successful fast requests.
Phase 4: Enable Self-Service Debugging
Observability data is useless if only SREs can access it.
Developer access - Give developers dashboards and query interfaces for their services. They should debug their own code.
Shared dashboards - Common views: service overview, error rates, latency percentiles, dependency maps.
Runbooks linked to alerts - When an alert fires, link to dashboards and queries that help diagnose the issue.
Collaborative debugging - Tools like Honeycomb or Lightstep allow sharing queries and collaborating on investigations.
Common Mistakes
Treating Observability as a Tool
Observability isn't software you buy. It's a property of your systems.
You build observable systems through instrumentation, data collection, and cultural practices that prioritize debugging capabilities.
Focusing Only on Dashboards
Pre-built dashboards are monitoring, not observability.
Observability requires ad-hoc query capabilities. When investigating a novel issue, you need to filter, group, and aggregate data in ways you didn't anticipate.
Insufficient Instrumentation
"We added metrics to the API gateway" isn't enough.
Every service, every database query, every external API call needs instrumentation. Gaps in instrumentation are gaps in understanding.
Ignoring Costs
Full-resolution metrics, logs, and traces at scale are expensive.
Implement retention policies. Sample traces intelligently. Use cheaper storage tiers for older data. But don't sacrifice observability to save money—the cost of debugging production issues without observability far exceeds storage costs.
No SLOs to Drive Observability
Service Level Objectives (SLOs) focus observability efforts.
Define SLOs: "99.9% of API requests complete in under 200ms." Then instrument to measure whether you're meeting SLOs. Alert when SLO budget is burning too fast.
Your Next Move
Assess your current observability maturity:
- Can you trace a request through your entire system?
- Can you answer: "Show me all requests from Customer X that failed in the last hour"?
- Can developers debug their services without involving operations?
If any answer is no, you have observability gaps.
Start with one service. Implement full instrumentation: metrics, structured logs, distributed tracing. Prove value. Expand to more services.
Work With Us
Tech Blend implements observability strategies for enterprises running complex distributed systems.
If your organization needs help with:
- Observability architecture and tooling selection
- OpenTelemetry implementation
- High-cardinality data strategy
- SLO definition and monitoring
Get in touch: Email us at sales@techblendconsult.io
References
Want more insights like this?
Subscribe to get weekly DevSecOps guides, security best practices, and infrastructure tips delivered to your inbox.
No spam. Unsubscribe anytime.